
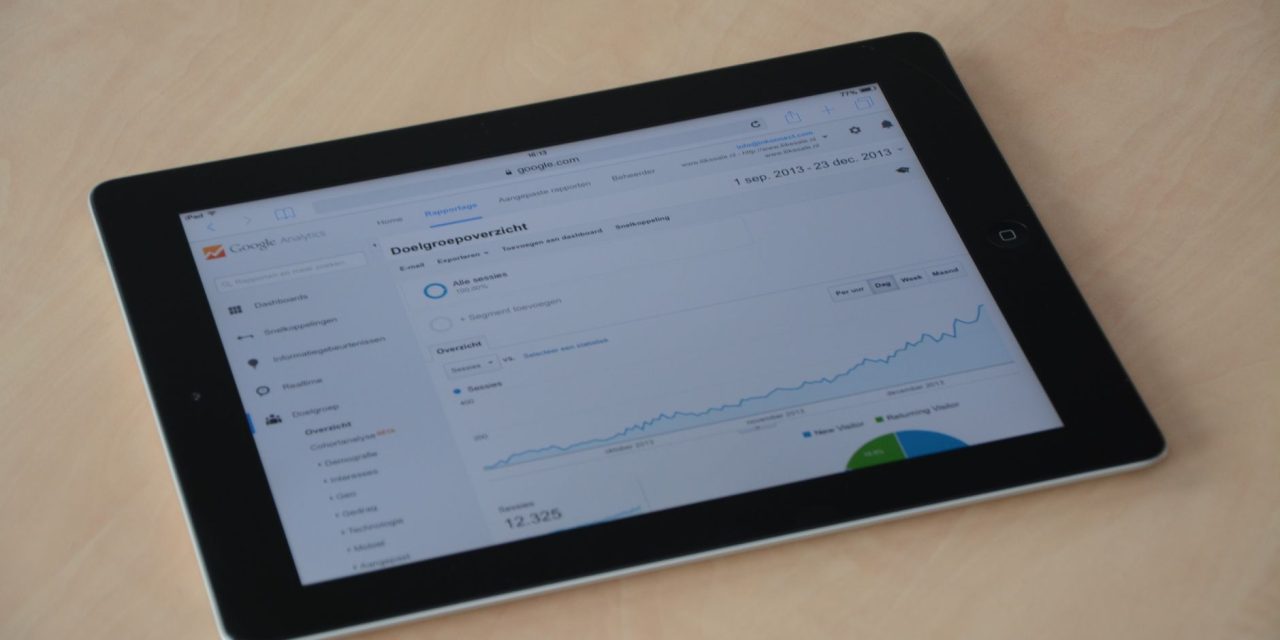
Google Ads is introducing a simpler way to get answers from campaign data: describe what you want to analyze in plain language, and Google builds the chart — plus a written explanation of what might be driving the change. The feature, called AI Dashboards, began appearing in some advertiser accounts after Google announced it in August.
How it works
Rather than manually picking metrics, dimensions and chart types, advertisers can type a request and Google will generate a visual report. Each automatically produced dashboard also includes a real-time AI summary that offers possible explanations for performance shifts — an attempt to surface the “why” alongside the numbers.
Google says the capability is powered by its Gemini models and frames AI Dashboards as part of a broader push to let advertisers interact with campaign data through natural language. It follows earlier additions such as AI-generated insights on the Google Ads homepage and Ask Advisor, an in-product assistant that answers performance questions in plain English.
Why this matters for teams
Creating custom reports in Google Ads has long required hands-on configuration. AI Dashboards reduce that setup time, which can matter for agencies and in-house teams juggling multiple accounts. If the automated reports are accurate and configurable, teams could spend less time assembling charts and more time testing, optimizing and acting on insights.
That shift changes the workflow: report generation becomes a prompt-and-review task rather than a manual build. The practical benefit depends on how reliably the AI surfaces relevant metrics and how easily users can verify or adjust what the dashboard shows.
Limits and practical precautions
AI summaries can speed triage, but treat them as starting points, not final explanations. Machine-generated interpretations may highlight plausible causes, but they can also omit context, misattribute signals or oversimplify multi-cause changes. Always cross-check AI findings against raw data and your business context before acting.
Three capabilities to watch as the rollout continues: how broadly Google enables AI Dashboards across account types, whether users can correct or choose specific metrics and dimensions within the generated dashboards, and how transparent the AI is about its reasoning and data sources. Export options and integration with existing analytics pipelines will determine how easily teams incorporate these dashboards into established reporting processes.
What advertisers should do now
Start by experimenting in any accounts where AI Dashboards appear. Use them to speed diagnostic workflows — for example, to surface candidate causes behind a sudden CTR or conversion-rate shift — but document and verify the AI’s suggestions against raw campaign data and external signals such as landing page changes or bid strategy adjustments.
Ask these practical questions during tests: Does the dashboard expose the underlying metrics and date ranges? Can you reproduce the AI summary using the raw numbers? Are the suggested drivers consistent with known calendar events, budget changes or audience updates? These checks will show whether the feature genuinely reduces reporting friction or simply moves it behind a generated narrative.
Where this fits in Google’s strategy
AI Dashboards are another instance of Google inserting AI into the advertiser workflow: letting people ask performance questions in natural language rather than navigating menus and building charts manually. That can accelerate routine analysis but also raises governance questions about reliance on platform-generated explanations.
The practical test will be whether AI summaries help teams identify root causes without introducing misleading or oversimplified conclusions. If they do, advertisers can reclaim time from report-building and redirect it toward optimization and strategy. If they don’t, teams will need disciplined verification steps before trusting platform-supplied explanations.
The rollout was first reported by paid-search specialist Thomas Eccel on LinkedIn.
What to watch next
Track availability across account types, the depth of metric controls, and how the feature integrates with exports and API workflows. Those factors will determine if AI Dashboards are a genuine productivity win or a convenience that still requires significant manual validation. Either way, teams should treat the feature as a tool to speed investigation — not a substitute for verification.